how can we help You?
Phone
- 977 279 187
Our Address
Carretera Falset, Gratallops km 6, Falset, Tarragona 43730
- comunicacio@masmartinet.com
- masmartinet@masmartinet.com

The concepts about vigour, which we have already explained, acquired through years of experiences and occasional checks, we wanted to extend them and organise them in a more accurate study about Garnatxa. It is a study carried out by Jolette Steyn as a final project for the International Master Vintage, and that she presented at the École Supérieure d’Agriculture d’Angers (France) on 12th October 2011.
This study was carried out in a very heterogeneous plot where, in previous years, 15 or 25 buds per vine had been kept. As a result of the heterogeneity with respect to the vines vigour, some of them, the most vigorous ones, had to be pruned twice or three times, but the shoots of the weakest ones did not reach 50 cm in length. Because of this, we decided to apply the concept of vigour distribution.
1st group: vines with a vigour from 100 g up to 349 g (low vigour)
2n group: vines with a vigour from 350 g up to 649 g (medium vigour)
3rd group: vines with a vigour from 650 g up to 999 g (medium-high vigour)
4th group: vines with a vigour above 1000 g (high vigour)
To help us interpret the results obtained, we applied different relationships in order to understand the vines reaction to the pruning carried out.
1 Wood production
After observing the charts with the data about the vigour and the shoots, we can see that there is a direct relationship between the reduction in the number of shoots in the pruning and the increase in vigour during the vegetative growth stop cycle.
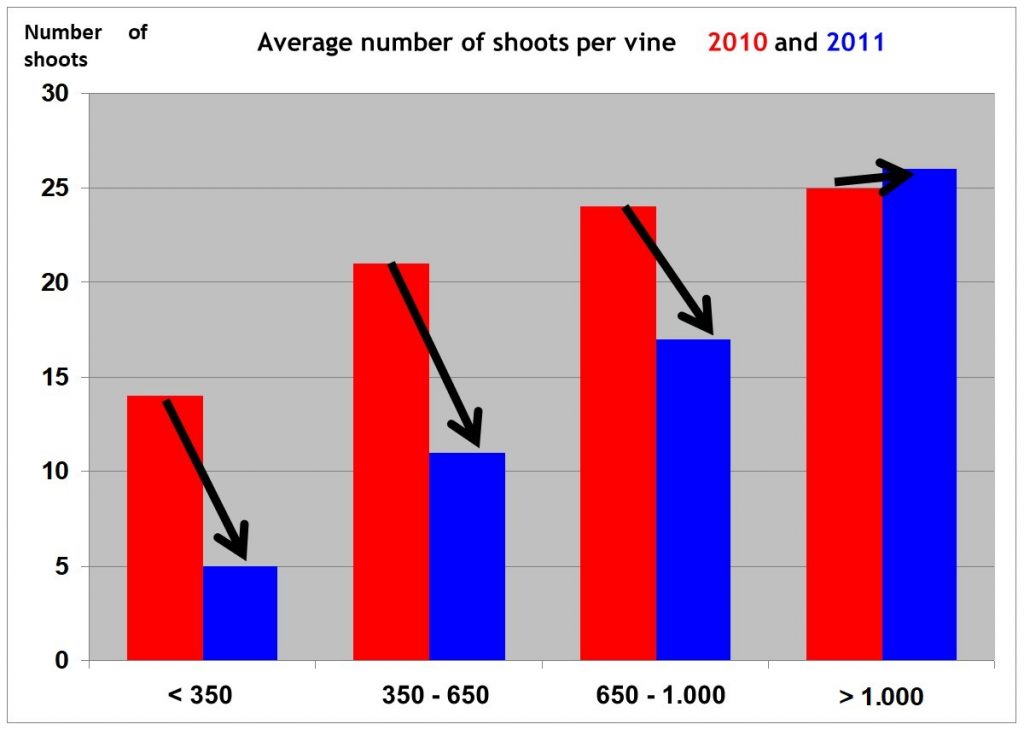
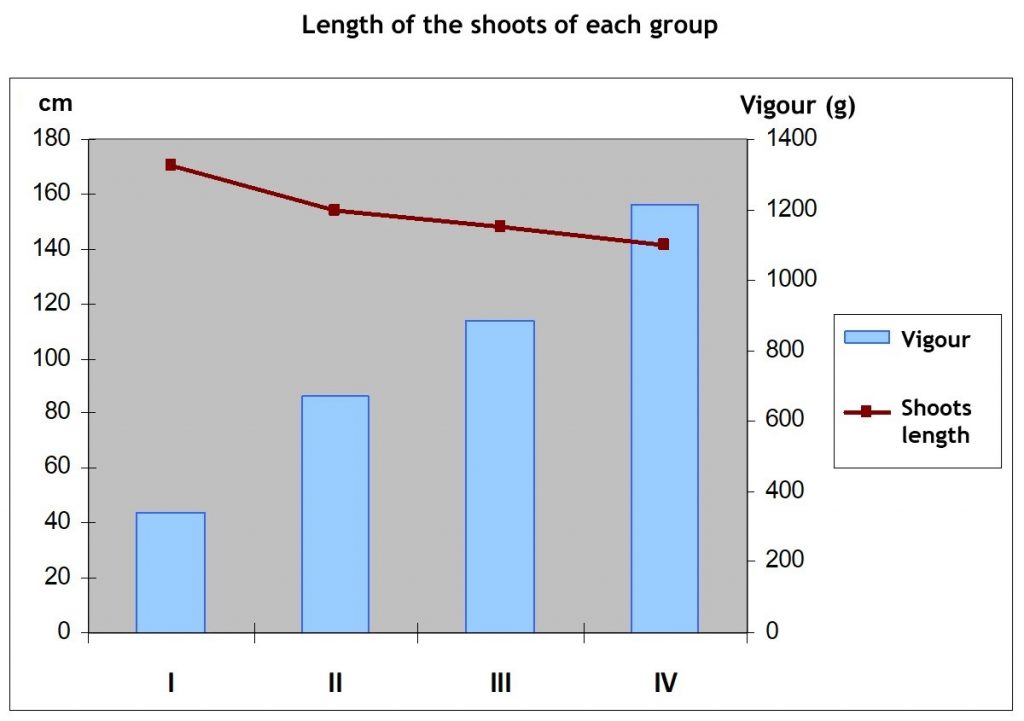
At the beginning of the experience, that is to say, in the winter of 2011, the pruning was done considering the weight of the shoots of each vine, in other words, considering the vigour of the vines. As we can observe in chart no. 1, with respect to the vines of the first three groups, in 2010 many of their shoots were kept because of their vigour, and we reduced them in 2011. On the other hand, in the 4th group, the number of shoots was small because of their vigour, so we kept more in 2011.
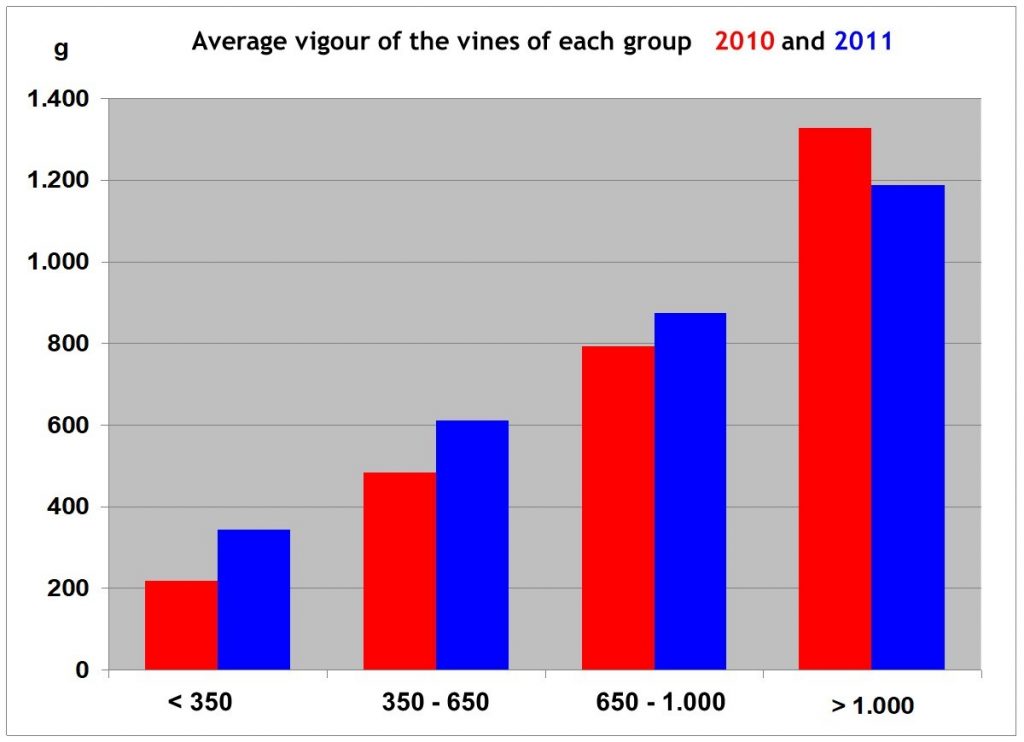
The vines reaction at the end of the 2011 cycle was that the first three groups increased their vigour compared to 2010, and that the 4th group reduced it, as we can see in chart no. 2.
We also observed a change in the weight of each shoot. In chart nº 3 we can see that there is an inversely proportional relationship between the change in the number of shoots and the change in the individual weight.
In the first group, which had extremely short shoots, the length and the individual weight of each shoot is what increased the most. The second and the third group are progressive in the same way, whereas the 4th group has reduced the weight of every shoot.

2 Grape production
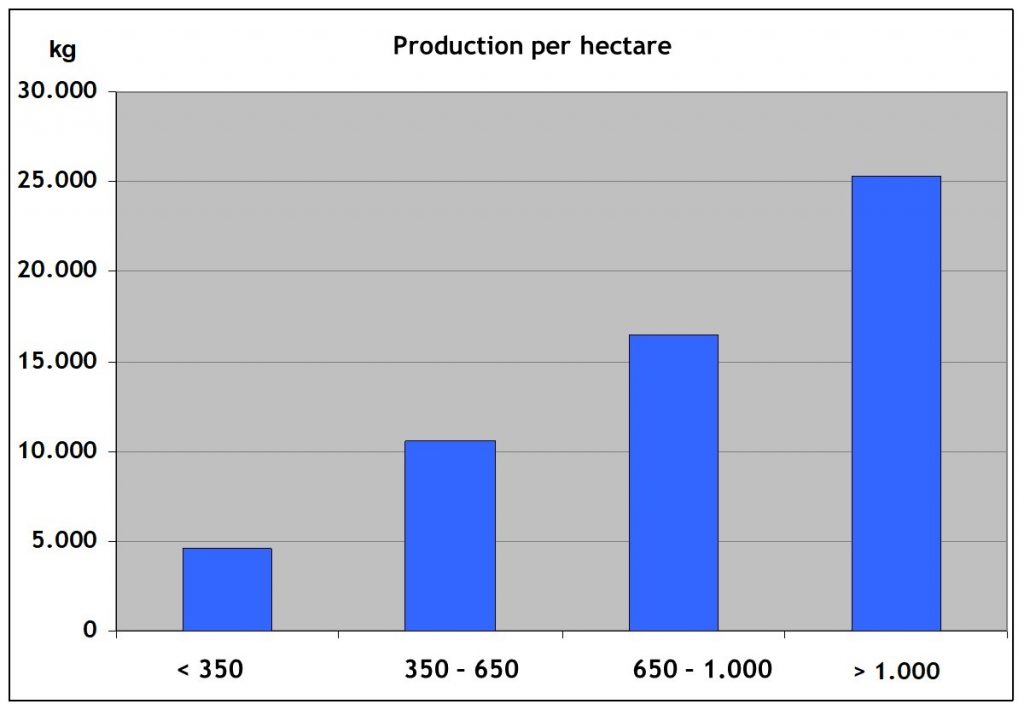
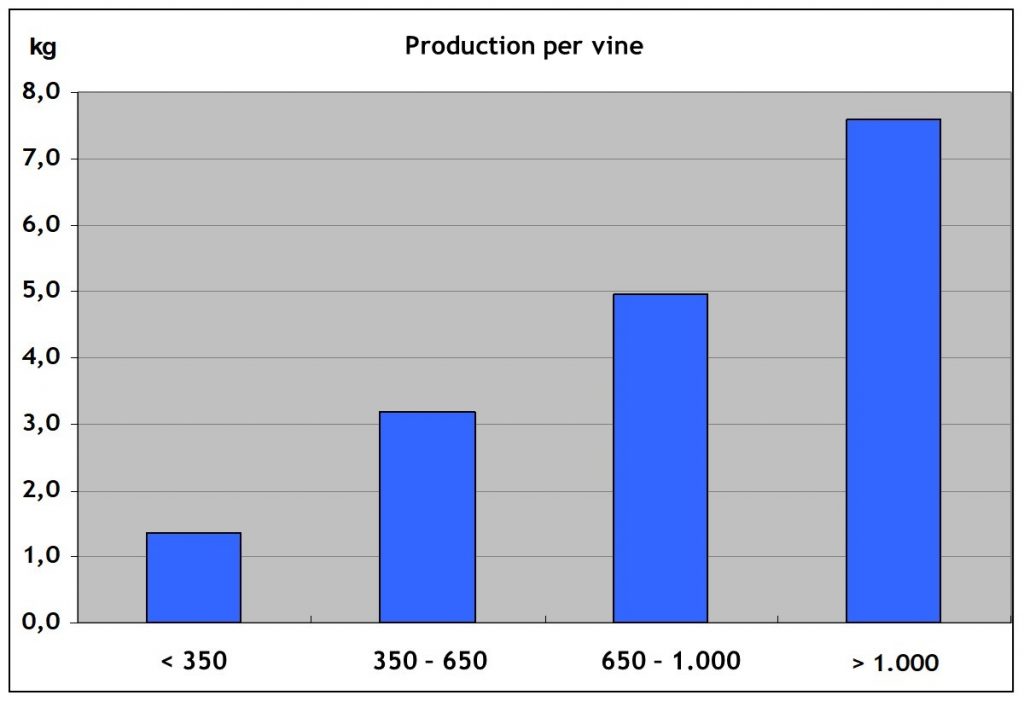
The grape production per ha was very different between the different groups because of the difference in vigour. Therefore, the production per ha and per vine are directly proportional to vigour. It is logical that the vines with a longer arm and more shoots produced more grapes. See charts 4, 5 and 2.
But attention!
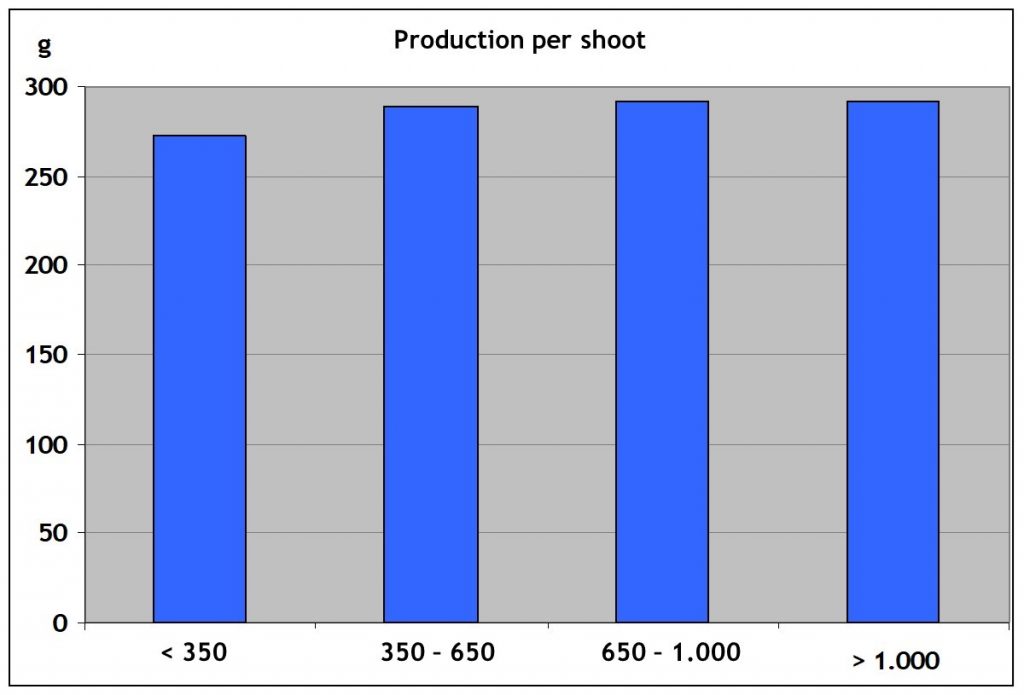
It is very interesting to observe that, on the other hand, the production per shoot is practically the same in all the groups, with very little difference. See chart nº 6.
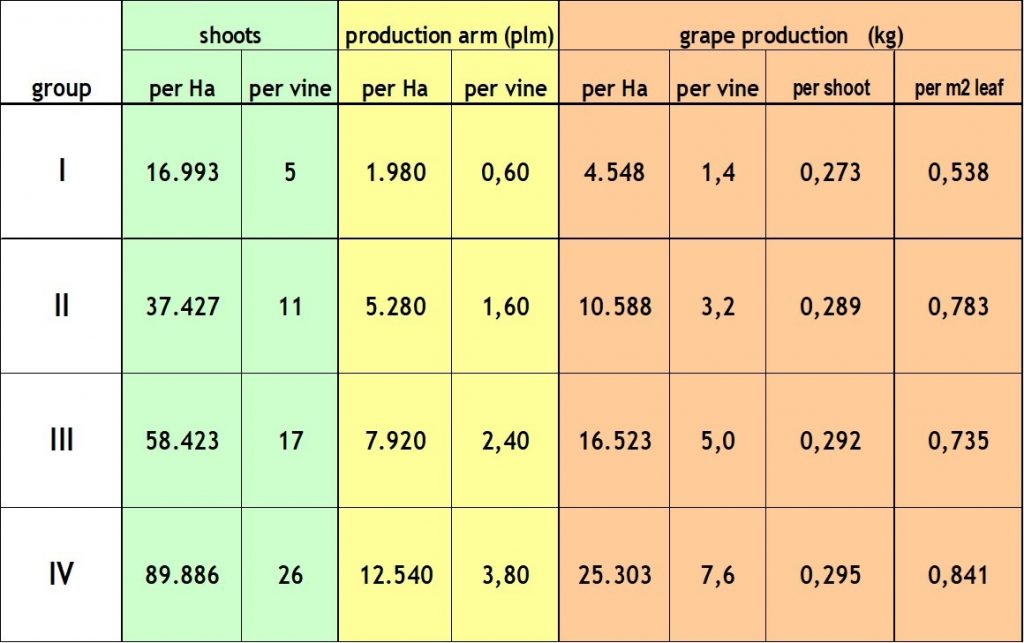
We can see a compilation of the production data in the following table:
3 Shoots length
In the whole plot, all the shoots with their grapes were very similar. We must remember that, in the first group, there were vines with a productive arm length of only 40 cm, and a vigour of 120 g, and in the 4th group, there were vines with 2,40 m-long arms and a vigour of 3.800 kg. However, the shoots and the grapes were very similar. Not only similar, but the small difference between them is inversely proportional to vigour.In chart nº 8 we can see that the vines with less vigour have slightly longer shoots, and the most vigorous ones have shorter shoots.
4 The wine
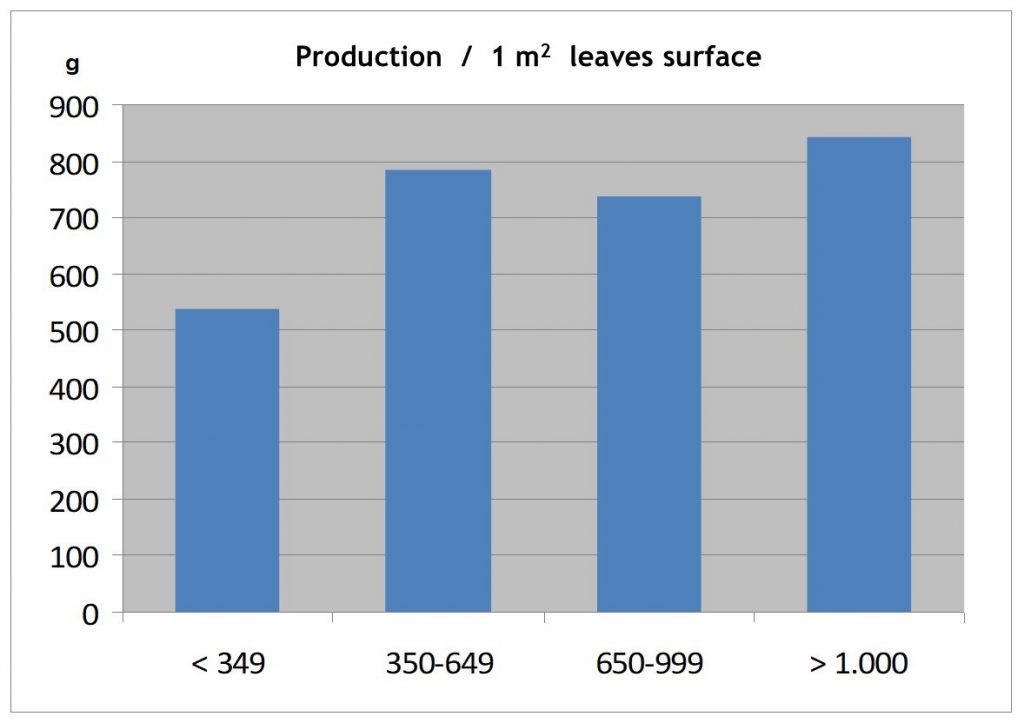
Now, if we link the production with the leaf area to see the grams of grapes produced by 1 m2 of leaf, we can see in chart no. 9 that there are some differences between the groups, specially between the first group and the other groups. The first group had a performance of 540 g of grapes per m2 of leaf, whereas the other three groups had between 700-800 g.
As the shoots of the first group were longer, this means more leaf area and, therefore, the performance per m2 of leaf is reduced.
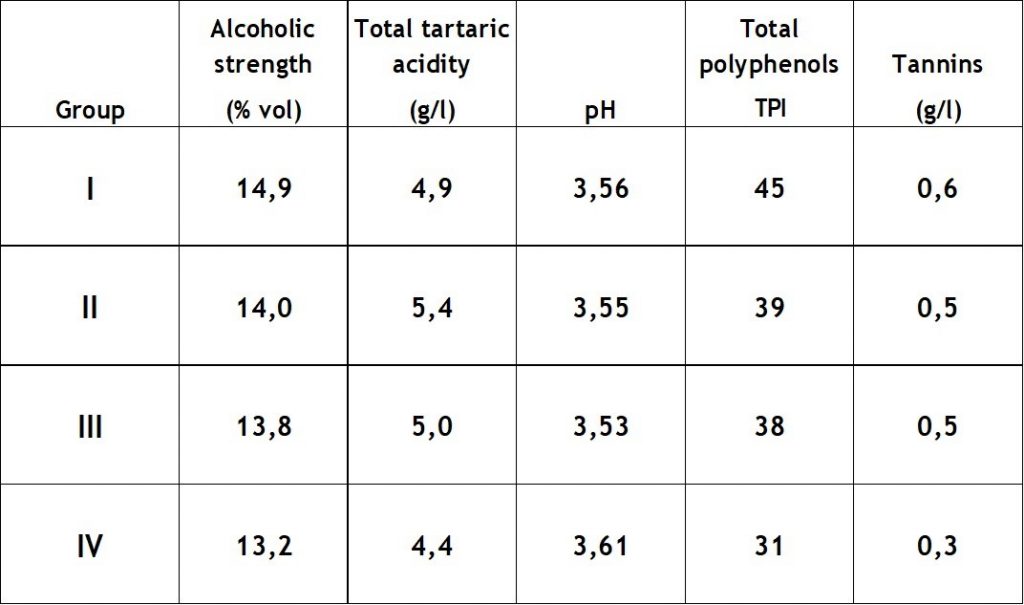
This is also reflected in the analysis of the wine made from each group. If we observe table no. 10, we can see that the wine from the first group has a higher content of alcohol, polyphenols and tannins.
Carrying out the wines taste, it was observed more structure in the wine of the first group, very similar to the second and the third group, and less body in the wine from the fourth group.
At the moment, we can say that:
However, these results make us ask ourselves if, in general:
When we keep in a vine more shoots than it had, does it react increasing its vigour?
Conversely, when we keep in a vine more shoots than it had, does it react reducing its vigour?
And how does this affect the quality of the grapes, which, in the end, is what interests us?
We encourage you to have a look at the Powerpoint 2nd part in which we explain better this experience.
Josep Lluís Pérez i Montse Ovejer
Carretera Falset, Gratallops km 6, Falset, Tarragona 43730